This article is purely technical, serving as a how-to document for developers utilizing the Dice Device as a platform for development.
Running a debugger on microcontrollers is often a challenging task. Sometimes, a special hardware tool called a ‘debug probe’ is required. Fortunately, newer boards come equipped with a built-in debugger, including the esp32-s3 used by the Dice Device. However, it’s not something that works out of the box. This article serves as a step-by-step guide to assist you in setting up and running a debugger on the Dice Device platform. It will not go into details on how to actually use a debugger, this is already well covered by many other tutorials.
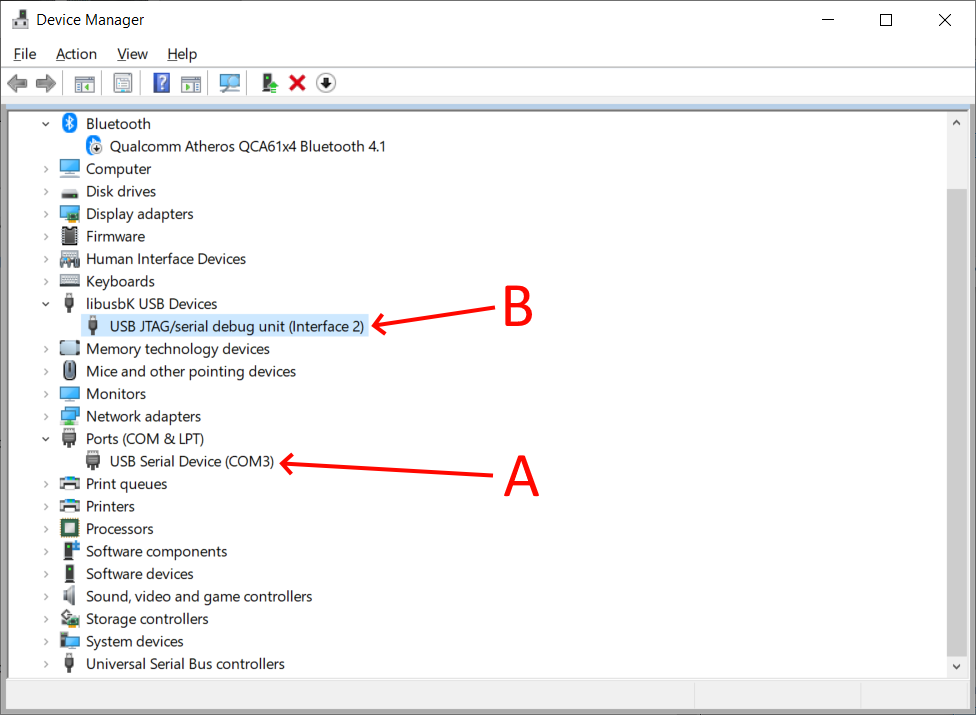
When connecting the Dice Device to your computer via a USB-C cable, two new USB devices will appear in the system. One is designated for primary communication (A), such as uploading a new program, while the second is prepared for debugging purposes (B). You can locate them by opening the Device Manager in Windows.
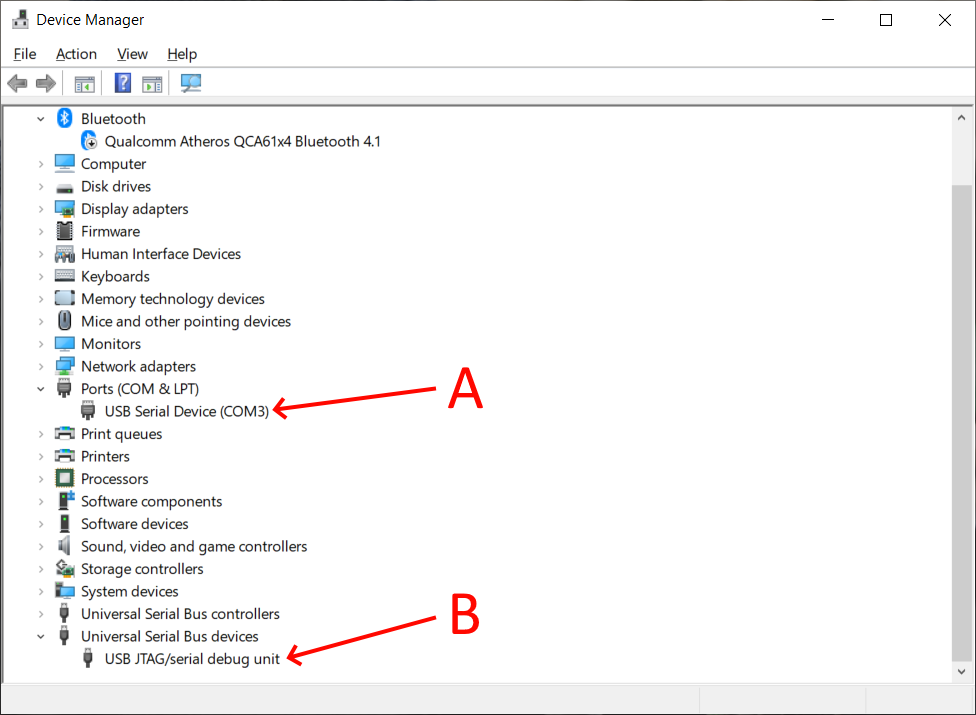
The primary device (A) is associated with a COM port, such as COM3 (the number may vary on your system), and it should work seamlessly. Uploading a new program should be possible without any additional effort.
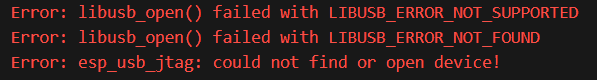
The secondary device (B) designed for debugging, however, is listed under ‘Universal Serial Bus devices’ and is not associated with the specific driver required by the debugger. If you attempt to run the debugger now, you will encounter errors like the following in the debug console:
What we need now is to install an appropriate driver for the secondary device (B) to enable communication with the microcontroller’s built-in debugger. To accomplish this, you can use a helpful and free tool called Zadig. It can be downloaded here: https://zadig.akeo.ie/
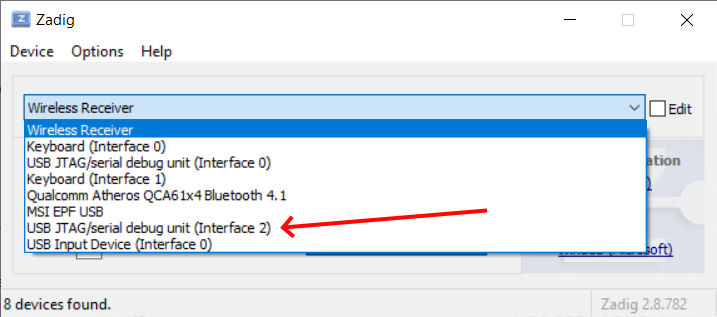
When running Zadig, choose ‘List All Devices’ under ‘Options’:

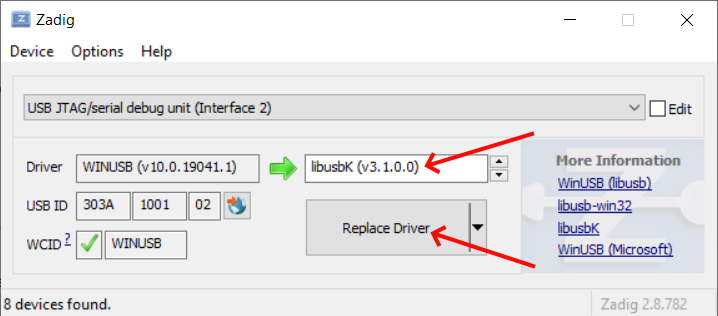
That will search for available USB devices and populate a list with them. In the next step, choose the secondary device (B), labeled ‘USB JTAG/serial debug unit (Interface 2)‘:
In the following step select the proper driver, which is ‘libusbK‘ and then click on ‘Replace Driver‘.
In a few moments, the drivers should be installed, and you can verify in Device Manager that the new driver is in place. This time, the secondary device (B) should be listed under ‘libusbK USB Devices‘.
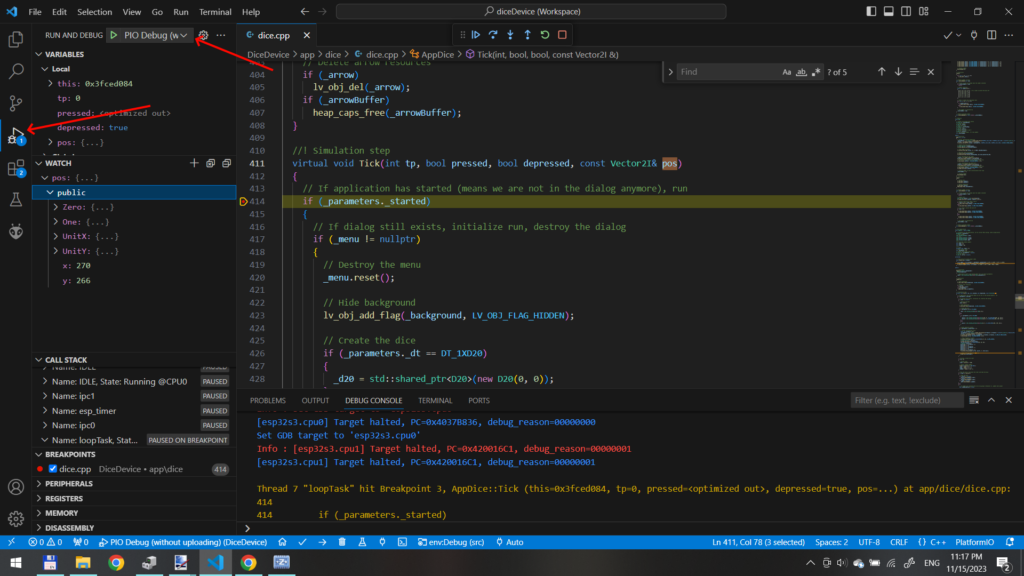
And that’s it. From this moment on, you can run a fully-featured debugger in Visual Studio Code. After uploading the program, simply select the Debugger panel and run ‘PIO Debug (without uploading) (Dice Device)‘: